


Bitcoin Price Plunges From $82K as $78,000 Becomes the Line
Bitcoin’s price was caught between short-term selling pressure and a still-rising daily trend Friday, Sept. 4, after a surge to $82,281 gave way to a retreat into the $79,000 area. The reversal puts a great deal of attention on whether buyers can defend nearby support while the broader technical picture remains supported by daily moving averages.

Key Takeaways
- Bitcoin’s price fell from $82,281 on Sept. 4, putting $78,531 support in focus.
- Bitcoin has 14 moving-average bullish readings despite 2 oscillator bearish signals.
- Bitcoin’s price faces $81,430 resistance, while a break below $76,800 raises risk.
Bitcoin’s 1-Hour Reversal Puts $78,500 Support on Watch
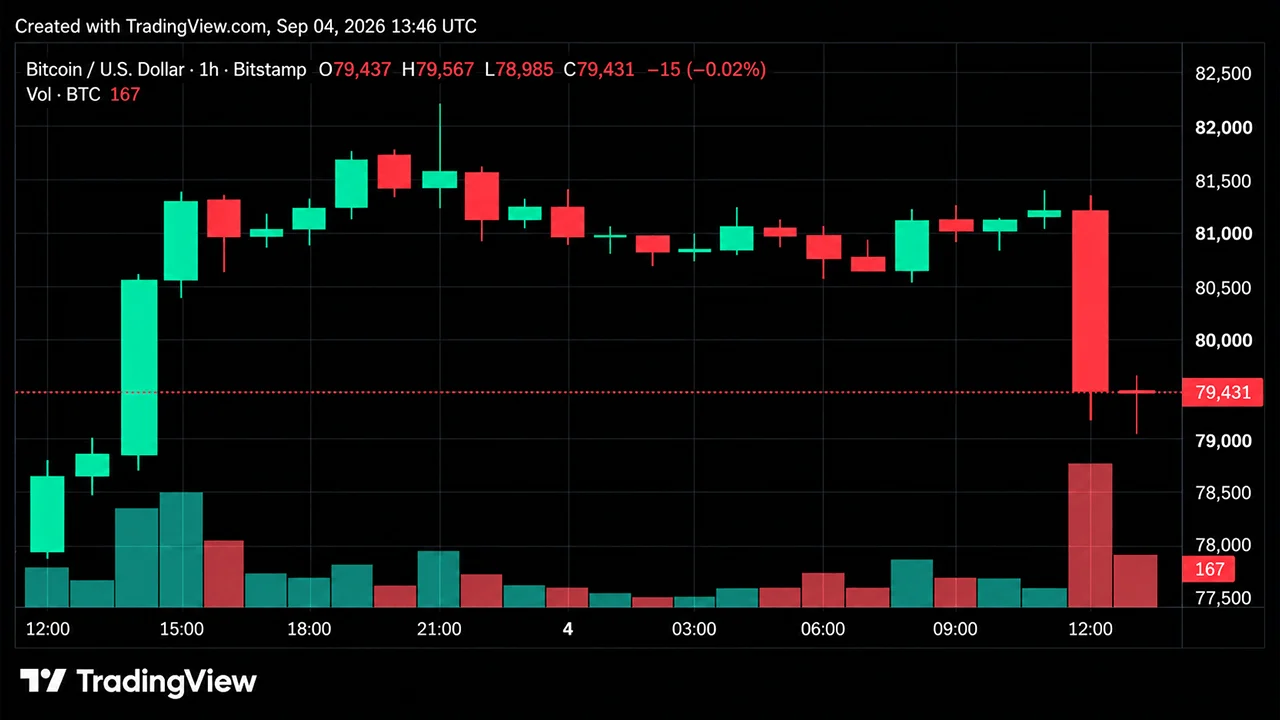
The 1-hour chart shows how quickly bitcoin’s price conditions changed in the crazy crypto market. Bitcoin logged a staircase advance through Sept. 3 before clocking a wick at $82,281, followed by a large red candle that drove bitcoin’s price into a cluster of bids around $79,000.
Last prints oscillated from roughly $78,990 to $79,230, while volume during the drop exceeded typical 1-hour bars from the prior session.
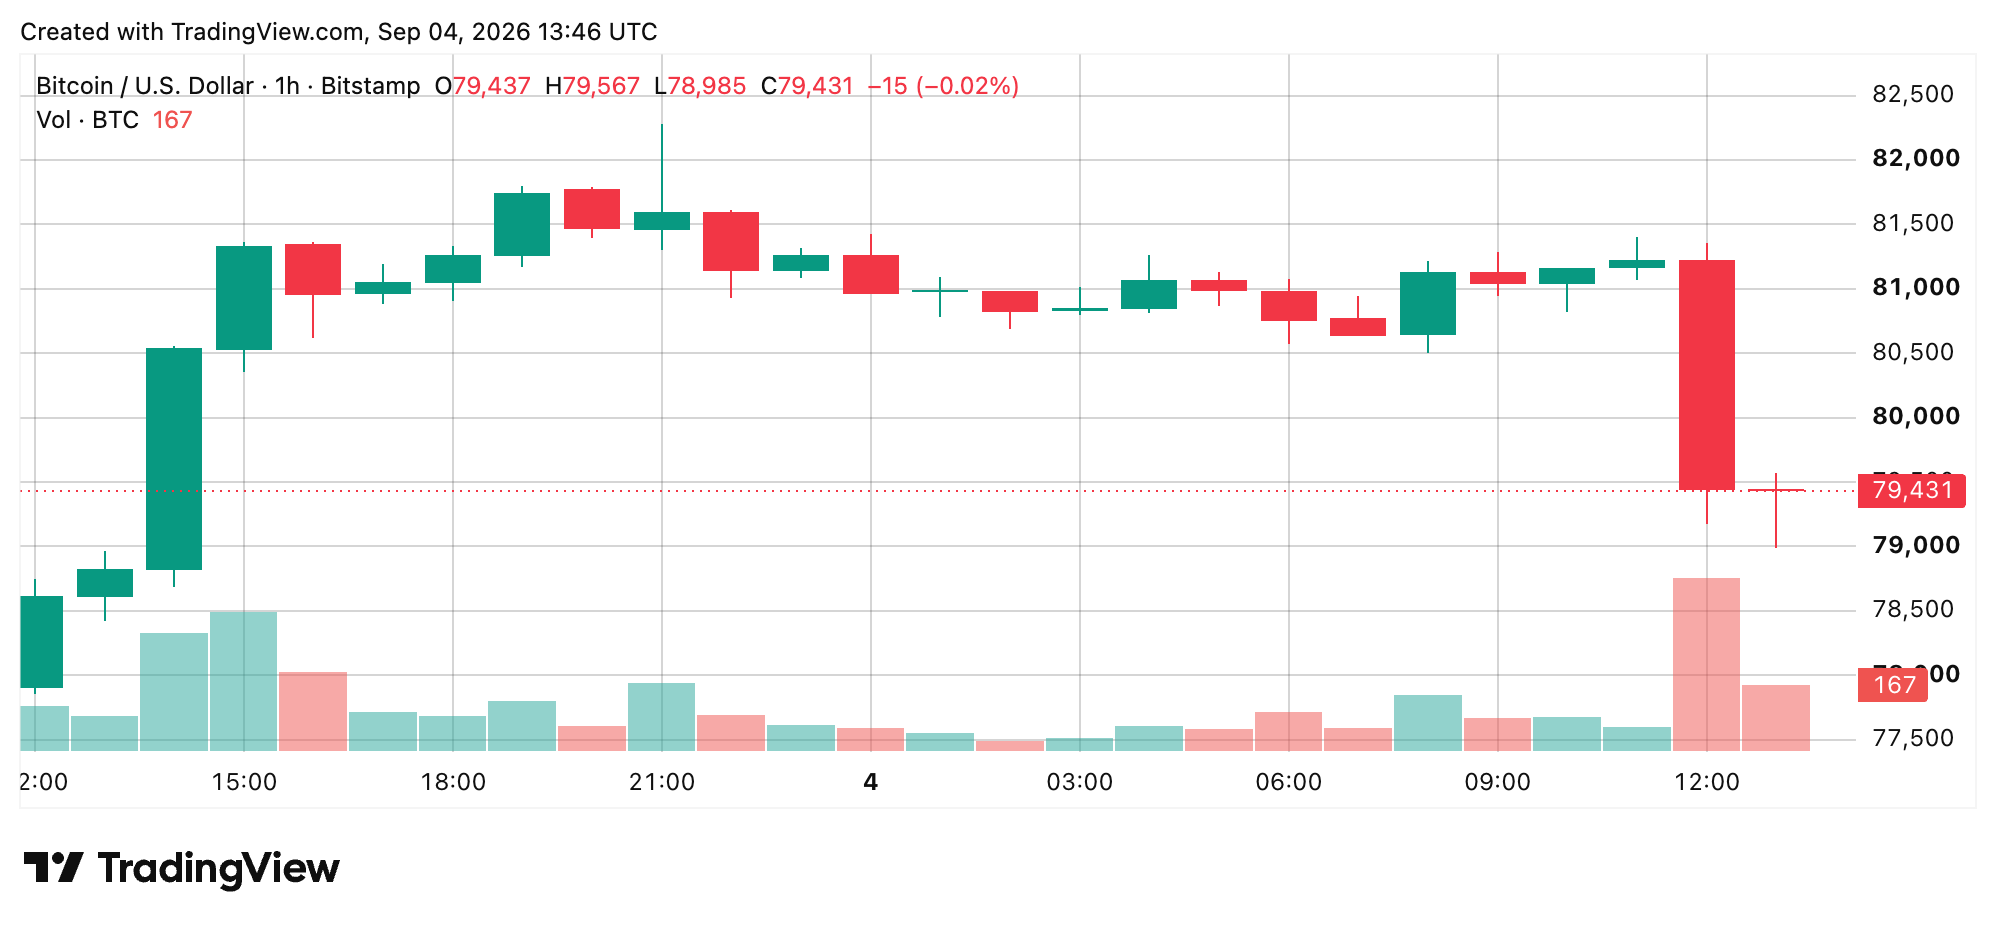
The $78,500-$79,200 pocket was being defended, making it a significant short-term area. Failure at $78,000 would open a measured move toward the $76,567-$77,300 origin of the latest rally. On the other hand, holding above $79,400 and then $80,335 would improve the short-term picture.
Bitcoin’s 4-Hour Chart Shows a Failed Extension
The 4-hour chart makes the rejection much clearer, showing a single impulse from the mid-$76,000s to $82,281 followed by a high-volume reversal. That amounts to a failed extension on the 4-hour timeframe, but it has not developed into a confirmed daily trend break based on the daily moving-average set.
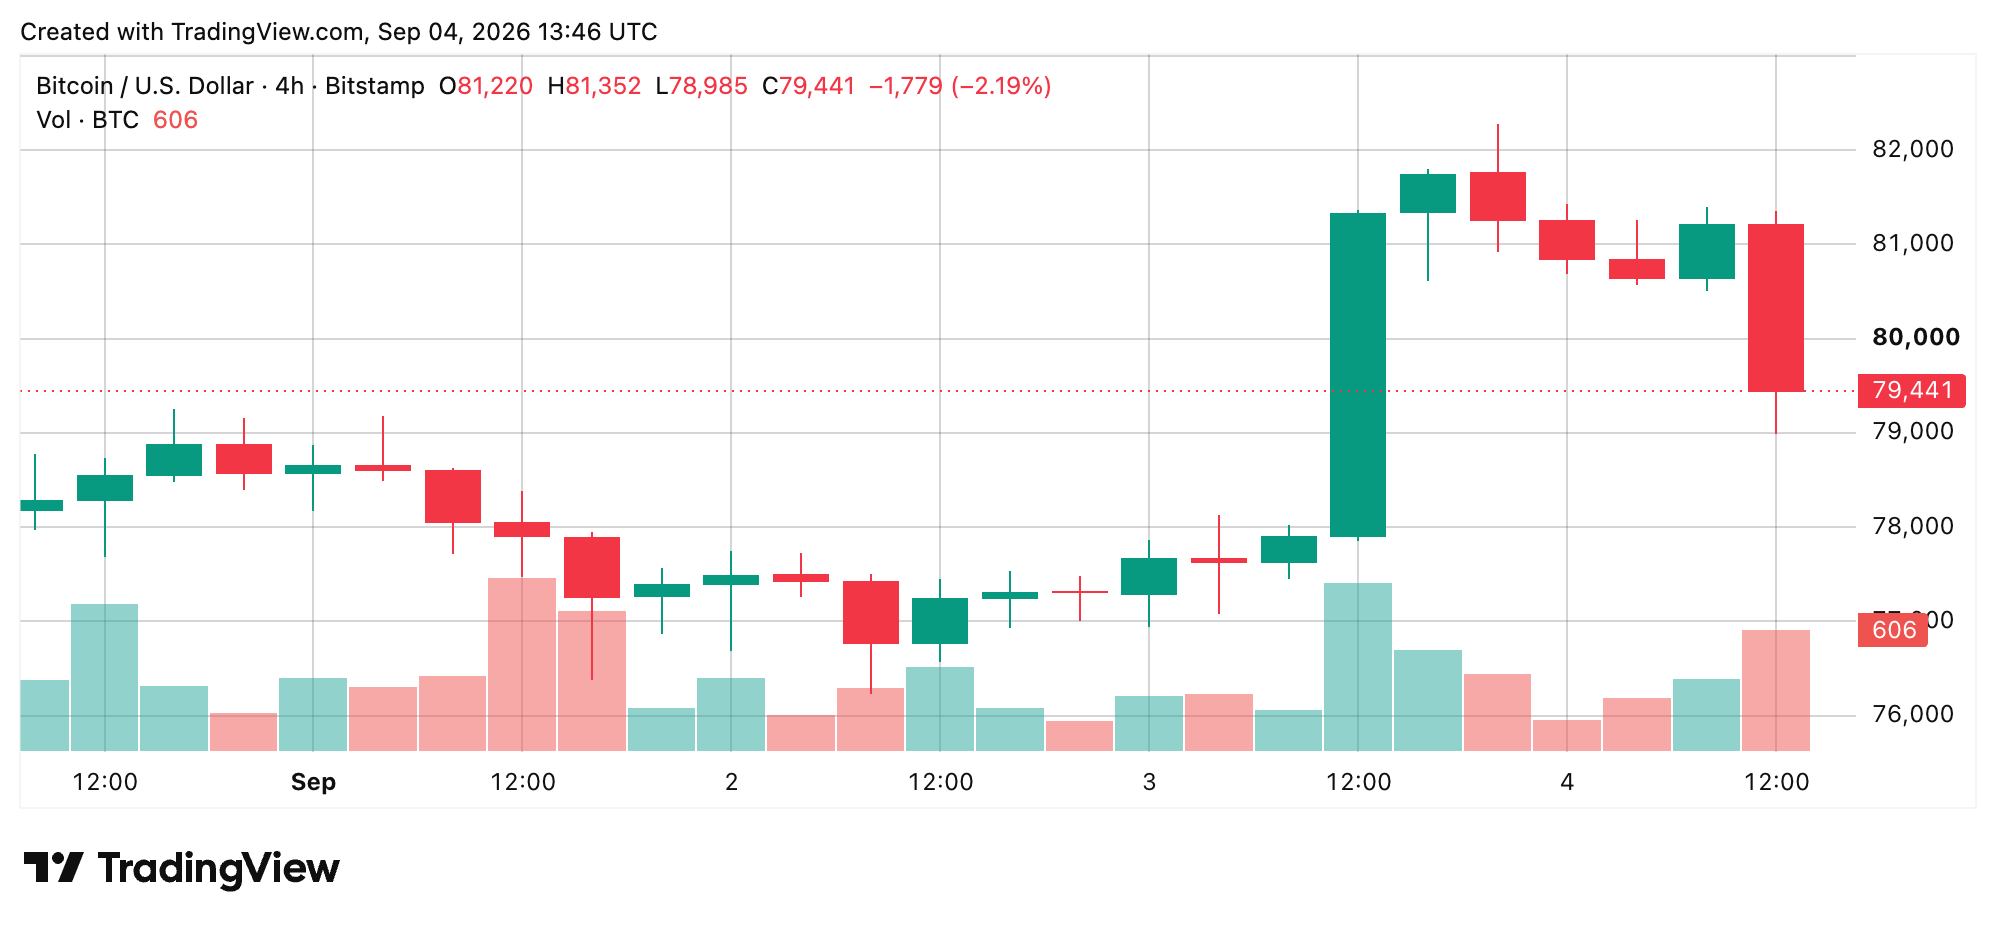
In this week’s wide array of volatile bitcoin prices, reclaiming and holding the $80,300-$81,400 resistance band would support the view that the rejection was only a 4-hour shakeout. On the flip side, losing $78,500 with follow-through toward $76,800 would invalidate Thursday’s breakout on this timeframe and put the lower support area back in the cards.
Bitcoin’s Daily Trend Holds Despite Friday’s Giveback
Bitcoin’s price trend via the daily chart offers a stronger, longer-term picture despite Friday’s retreat. Thursday opened near $77,300-$77,400, climbed to roughly $82,200-$82,300, and closed around $81,265 before Friday opened near $81,270 and reversed. Bitcoin’s price nevertheless remained above the Sept. 2 close near $77,300 and the daily moving-average stack, even as Friday produced a lower high against the $82,281 spike.
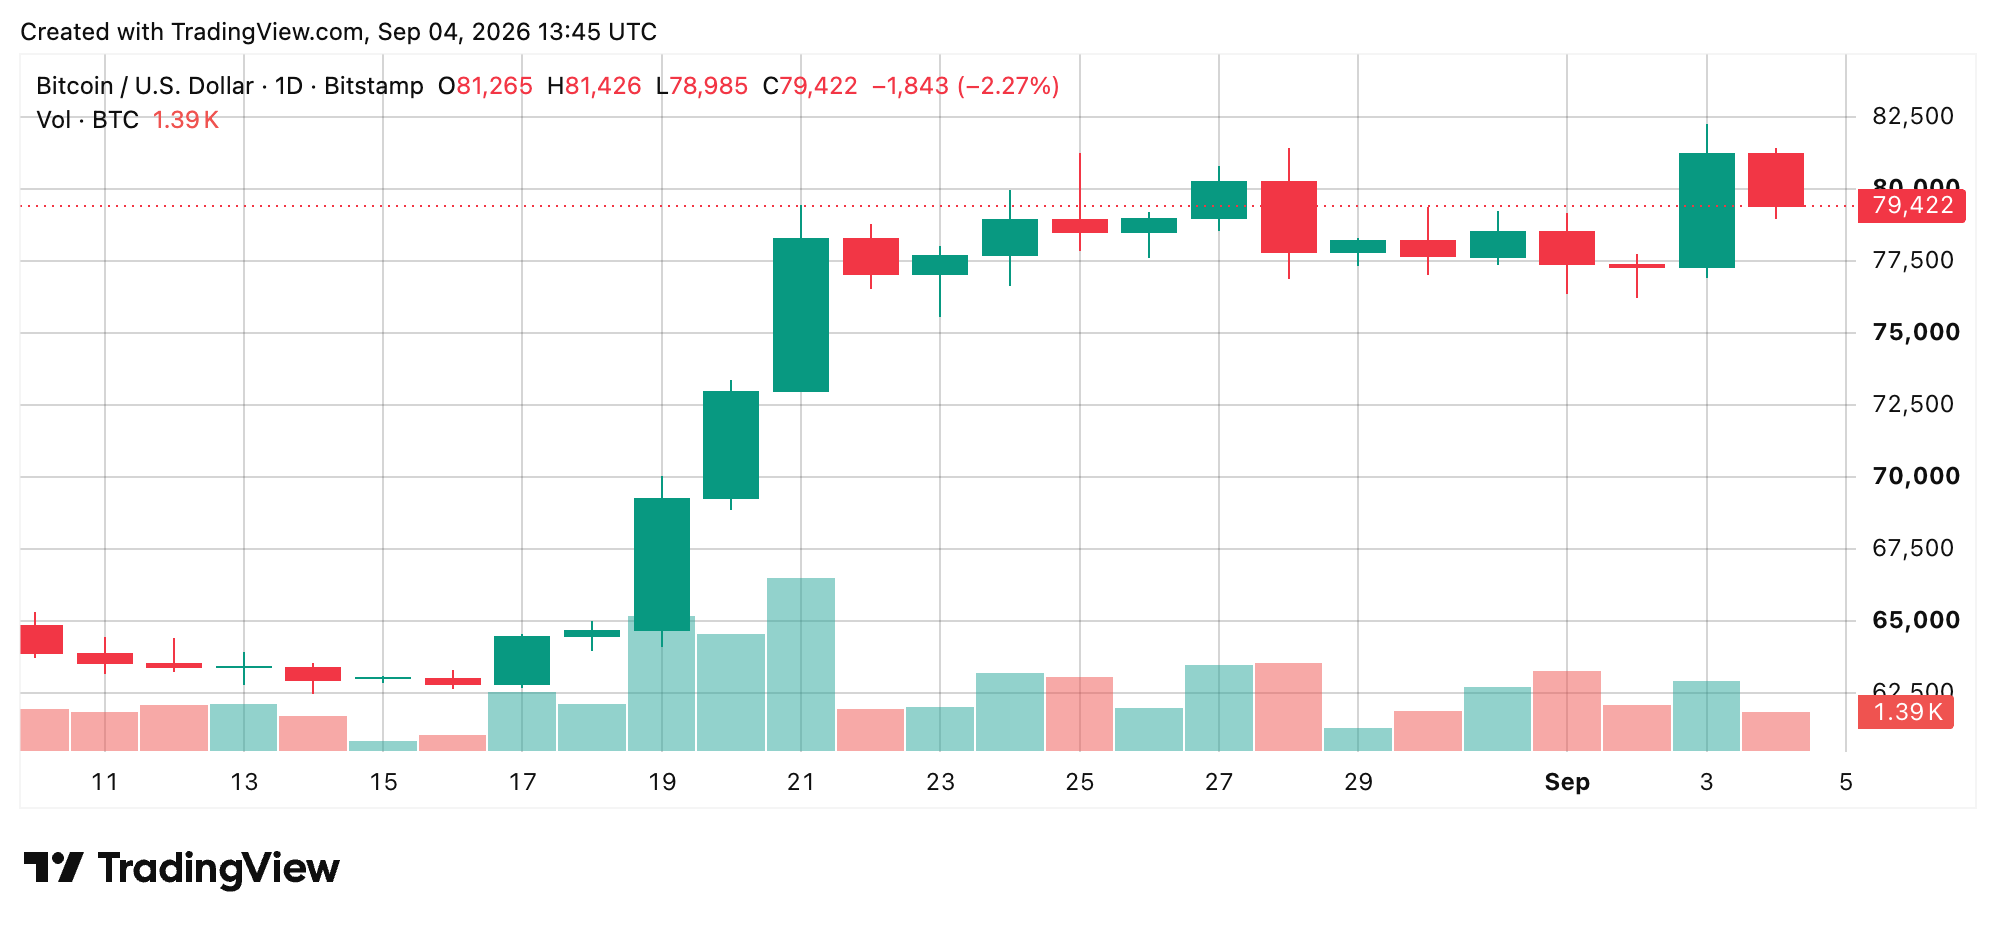
Resistance includes the Fibonacci first resistance level at $81,430 and the Camarilla second resistance level at $82,098. A daily close above $81,430-$82,281 would continue the Sept. 3 breakout, while a close below $76,800-$77,300 would put that impulse at risk and bring the $74,081 daily pivot into view.
Oscillators Show Caution Beneath the Broader Trend
Interestingly, the daily bitcoin price chart’s oscillators are much less enthusiastic than the moving averages. The relative strength index (RSI) stood at 66, Stochastic at 73, commodity channel index (CCI) at 71, average directional index (ADX) at 45, and Awesome oscillator (AO) at 8,044, with each rated neutral.
Momentum (MOM) clocked 1,214 with an uglier reading, while the moving average convergence divergence (MACD) level was 3,425 and also registered bearish. Overall, the oscillator gauge is somewhat neutral, logging two negative readings, nine neutral readings, and no bullish readings. That split shows weaker momentum even as the broader daily trend remains supported by its moving averages.
Moving Averages Keep the Larger Trend Buy-Biased
The moving average (MA) tape on Friday morning remains firmly buy-biased, with 14 of 15 the daily chart’s MA readings rated bullish. Bitcoin’s price traded above every listed exponential moving average (EMA) and simple moving average (SMA), but just below the 9-period hull moving average (HMA) at 79,420.
A break above that level would put $80,335 and $81,430 in focus, while $78,531 and the $76,800-$77,300 range remain significant downside levels to watch. At the time of writing, BTC is exchanging hands for $79,339 per coin, at 10 a.m. Eastern time.
Bull Verdict:
Bulls still have the bigger trend on their side. Bitcoin’s price remains above the key daily moving averages, and a push back through $79,420, followed by $80,335 and $81,430, would make the latest selloff look more like a sharp shakeout than a real trend change.
Bear Verdict:
Bears have the short-term momentum after bitcoin’s rejection from $82,281. If $78,531 gives way and selling carries into the $76,800-$77,300 range, Thursday’s breakout would be in serious trouble, with the $74,081 daily pivot potentially coming into play next.



Tags in this story
About the Author