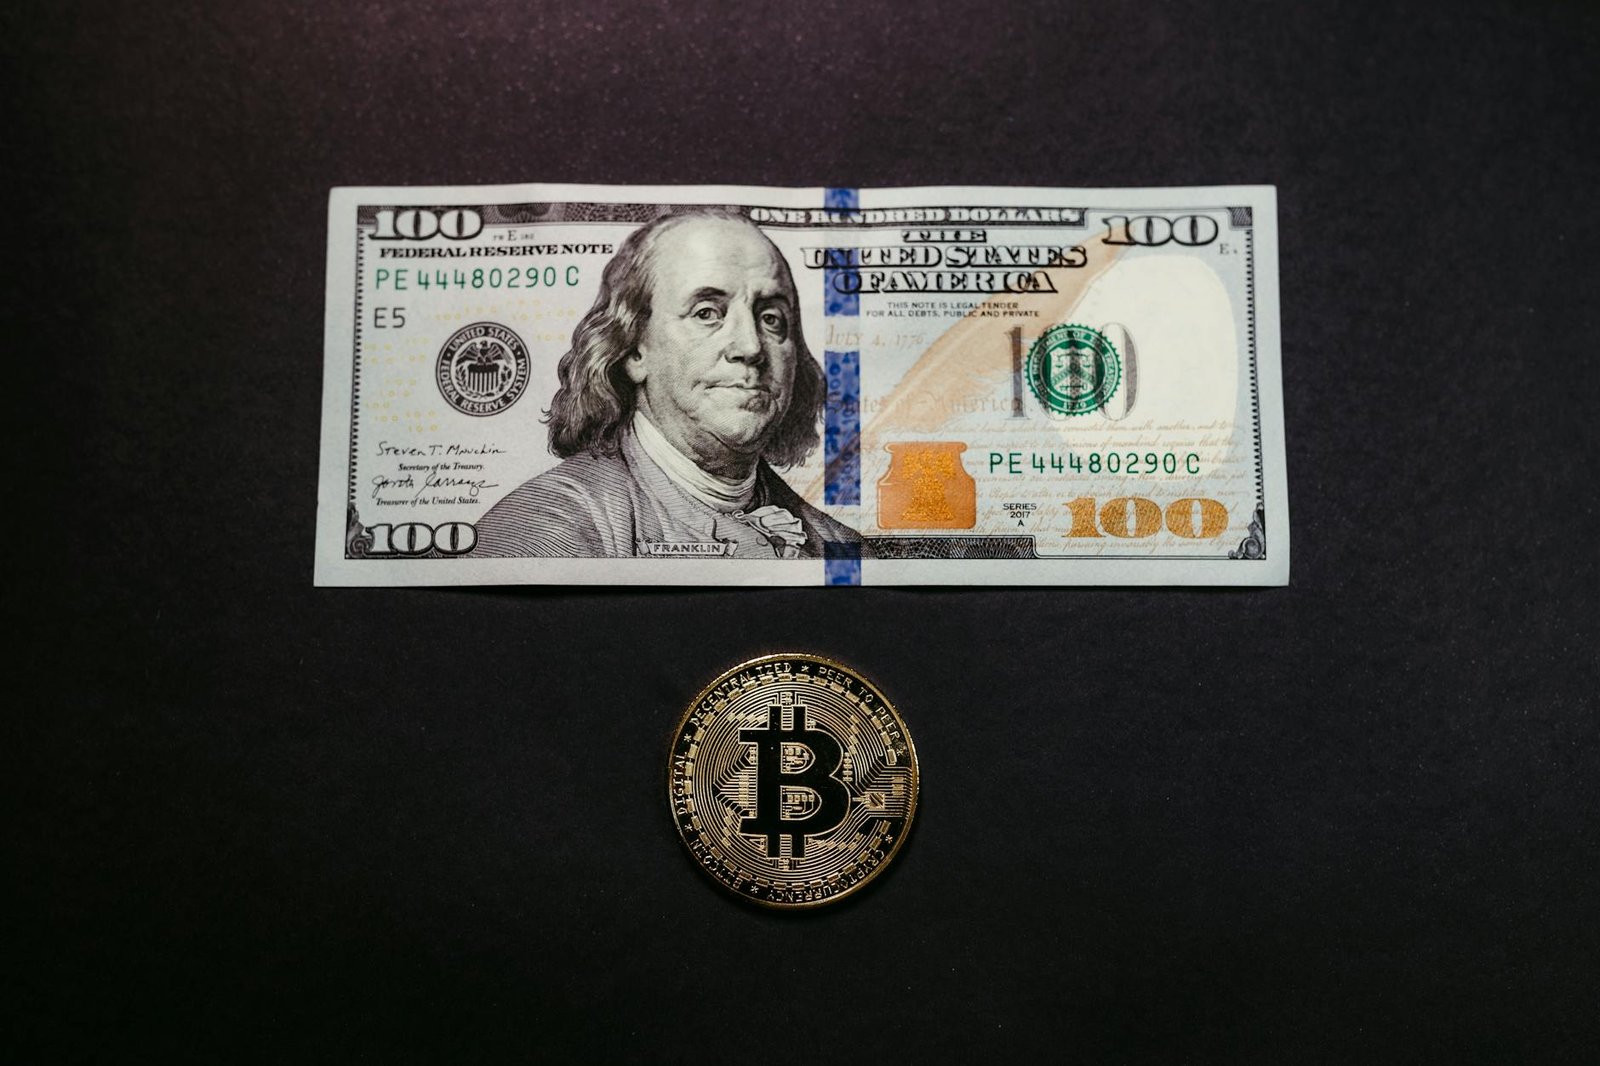
When one goes up, the other drops. (Pascal Bernardon/Unsplash)
What to know:
Bitcoin’s 30-day correlation with the U.S. Dollar Index has deepened to -0.90, its most negative level since 2022, meaning bitcoin has been moving sharply in the opposite direction of the dollar.
Roughly 81% of bitcoin’s recent short-term price moves are statistically linked to shifts in the index, and the cryptocurrency’s rally has stalled as the dollar has rebounded amid geopolitical and inflation risks.
Despite continued inflows into U.S. spot bitcoin ETFs, major investors remain cautious, with SkyBridge’s Anthony Scaramucci suggesting a more meaningful bitcoin recovery may not arrive until later in the year, while ether continues to underperform bitcoin on key technical measures.
Keep in mind, though, that the reading, while widely tracked, can be influenced by bitcoin’s 24/7 trading structure, particularly weekend price action that is not mirrored in the Dollar Index’s weekday-only trading.
The coefficient of determination, or correlation squared, comes in at 0.81, implying that roughly 81% of bitcoin’s short-term price moves are statistically associated with moves in the index.
Notably, bitcoin’s rally has stalled since hitting highs above $79,000 on Wednesday. This comes as DXY bounced to 98.75 from the April 17 low of 97.63.
This is an excerpt from CoinDesk newsletter ‘Daybook.’Sign up here, if you haven’t already.
The outlook for the Dollar Index appears supported by broader macro risks, including elevated oil prices tied to the tanker traffic disruptions in the Strait of Hormuz and a continued U.S.-Iran standoff over ceasefire negotiations.
“Macro is still trying to lean against it [BTC’s continued rally]. Oil has risen for five straight sessions and Hormuz remains effectively constrained. That should be a headwind because it keeps the inflation channel alive and keeps risk premia from fully unwinding,” analysts at Marex said in an email.
One positive is the sustained inflows into the U.S.-listed spot exchange-traded funds (ETFs). While those are keeping prices supported, industry leaders are still taking a cautious approach.
Anthony Scaramucci, founder of SkyBridge Capital, said bitcoin may not see a meaningful recovery until October or November, and the current price action aligns with BTC’s four-year reward halving cycle. He said that whales, who hold large numbers of BTC, and long-time holders have continued to sell into ETF-driven demand. Stay alert!
Read more: For analysis of today’s activity in altcoins and derivatives, see Crypto Markets Today . For a comprehensive list of events this week, see CoinDesk’s “Crypto Week Ahead.”
The chart shows daily swings in the ether-bitcoin (ETH/BTC) ratio in candlestick format since July last year.
This week, the ratio fell nearly 3% to 0.02965, its lowest since March 15. The move has two bearish implications.
First, it confirms a downside break from the short-term ascending channel that had guided the recovery from early February lows. Second, it pushes the ratio back below the broader downtrend line that has defined the decline since August.
This breakdown reinforces bearish momentum and increases the likelihood of further downside or extended consolidation in the ETH/BTC pair, that is, it points to continued underperformance of ether relative to bitcoin ahead.
Bitcoin’s latest push toward $80,000 stalled as rising oil prices, driven by risks around the Strait of Hormuz, tightened financial conditions and stoked inflation concerns.
Rising energy costs and higher government bond yields are weighing on risk assets, even as U.S.-listed spot bitcoin ETFs log their strongest week of inflows…